FarmRoad, WayBeyond
From Grafana Guesswork to a Single Source of Truth: Redesigning FarmRoad’s Device Management Experience
My Role: UX/UI Design, Information Architecture, User Research & Testing
Toolkit: Figma, FigJam, Jira
Collaborators: Hardware Engineer, Head of Customer Success, CS Support (on-site Morocco), Back-end & Front-end Engineer
The Challenge
FarmRoad's hardware - Folium sensors and gateways - needed a management surface customers and field teams could rely on. Field technicians installing hardware had no way to verify connectivity without pinging engineering, and CS burned time on basic "is my sensor online?" queries. The page had to serve two different users: growers who just want reassurance their sensors work, and field techs who need detail-level diagnostics during installs.
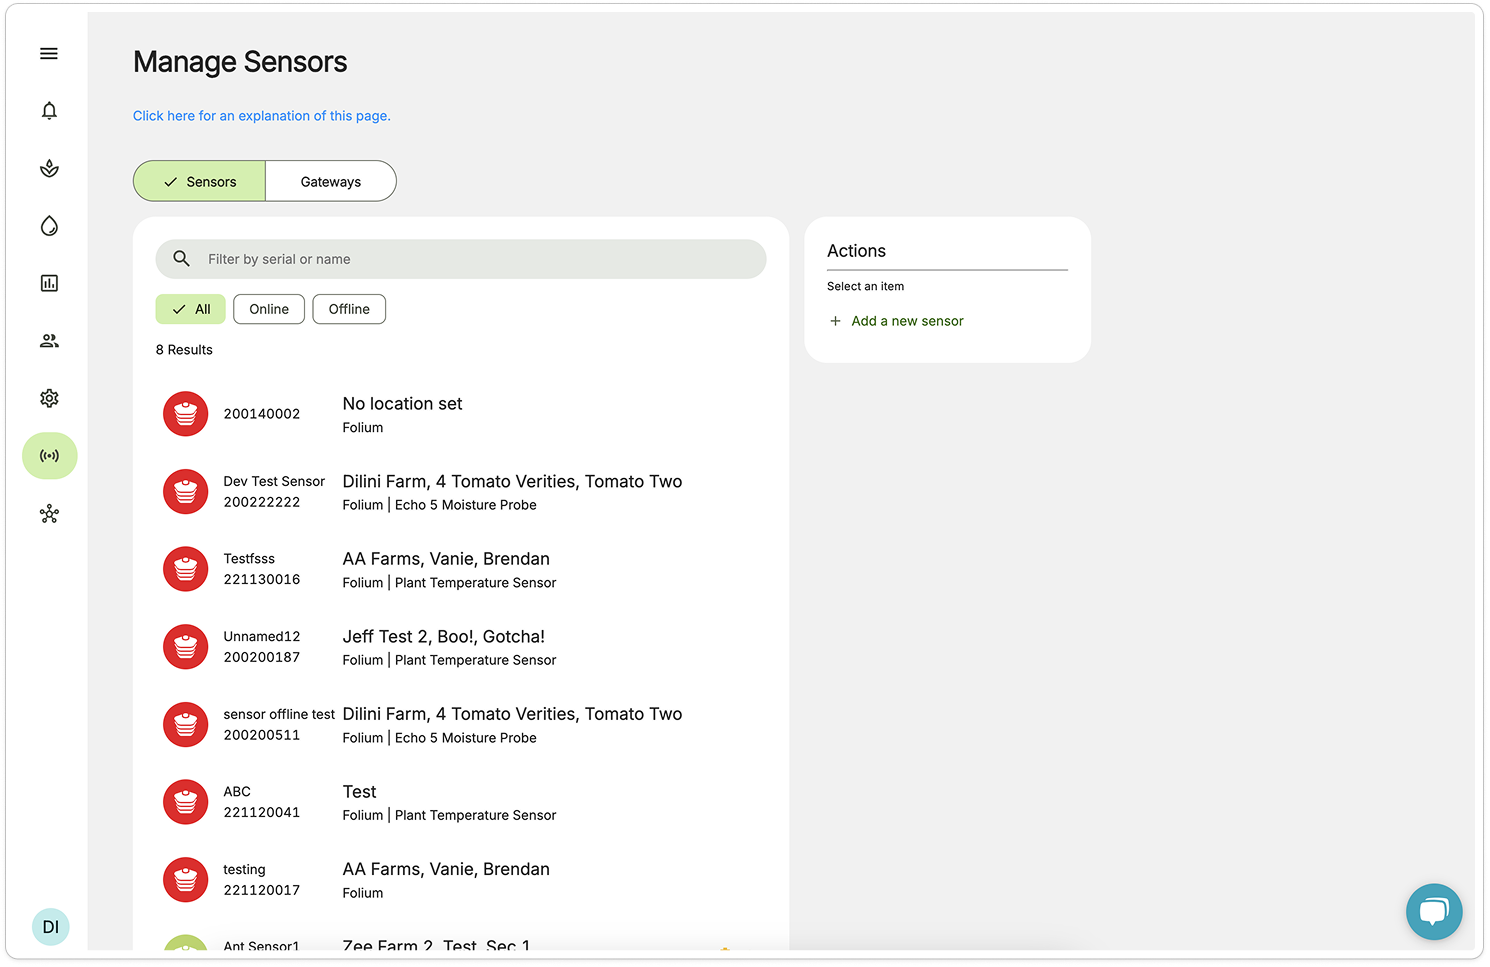
Old Design
The Problem
The sensor management page crammed status, location, and device details into two lines of subtext per row.
There was no way to identify a sensor’s signal strength relative to its gateway, or confirmation of whether a connected peripheral sensor was active, and if a sensor was displaying ’offline’ it could mean 1 of 4 things: it’s got a dead battery, it’s been damaged, the signal is too weak or the gateway it’s connected to is offline.
Apart from an online/offline toggle there was also no way to quickly sort sensors by farm, sector, or even device name.
There were ongoing issues with problems being present, and precious time being wasted trying to diagnose them, for already time-poor farm managers and our own support team.
Behind the Scenes: reworking information architecture, wire-framing, prototyping, building new components etc
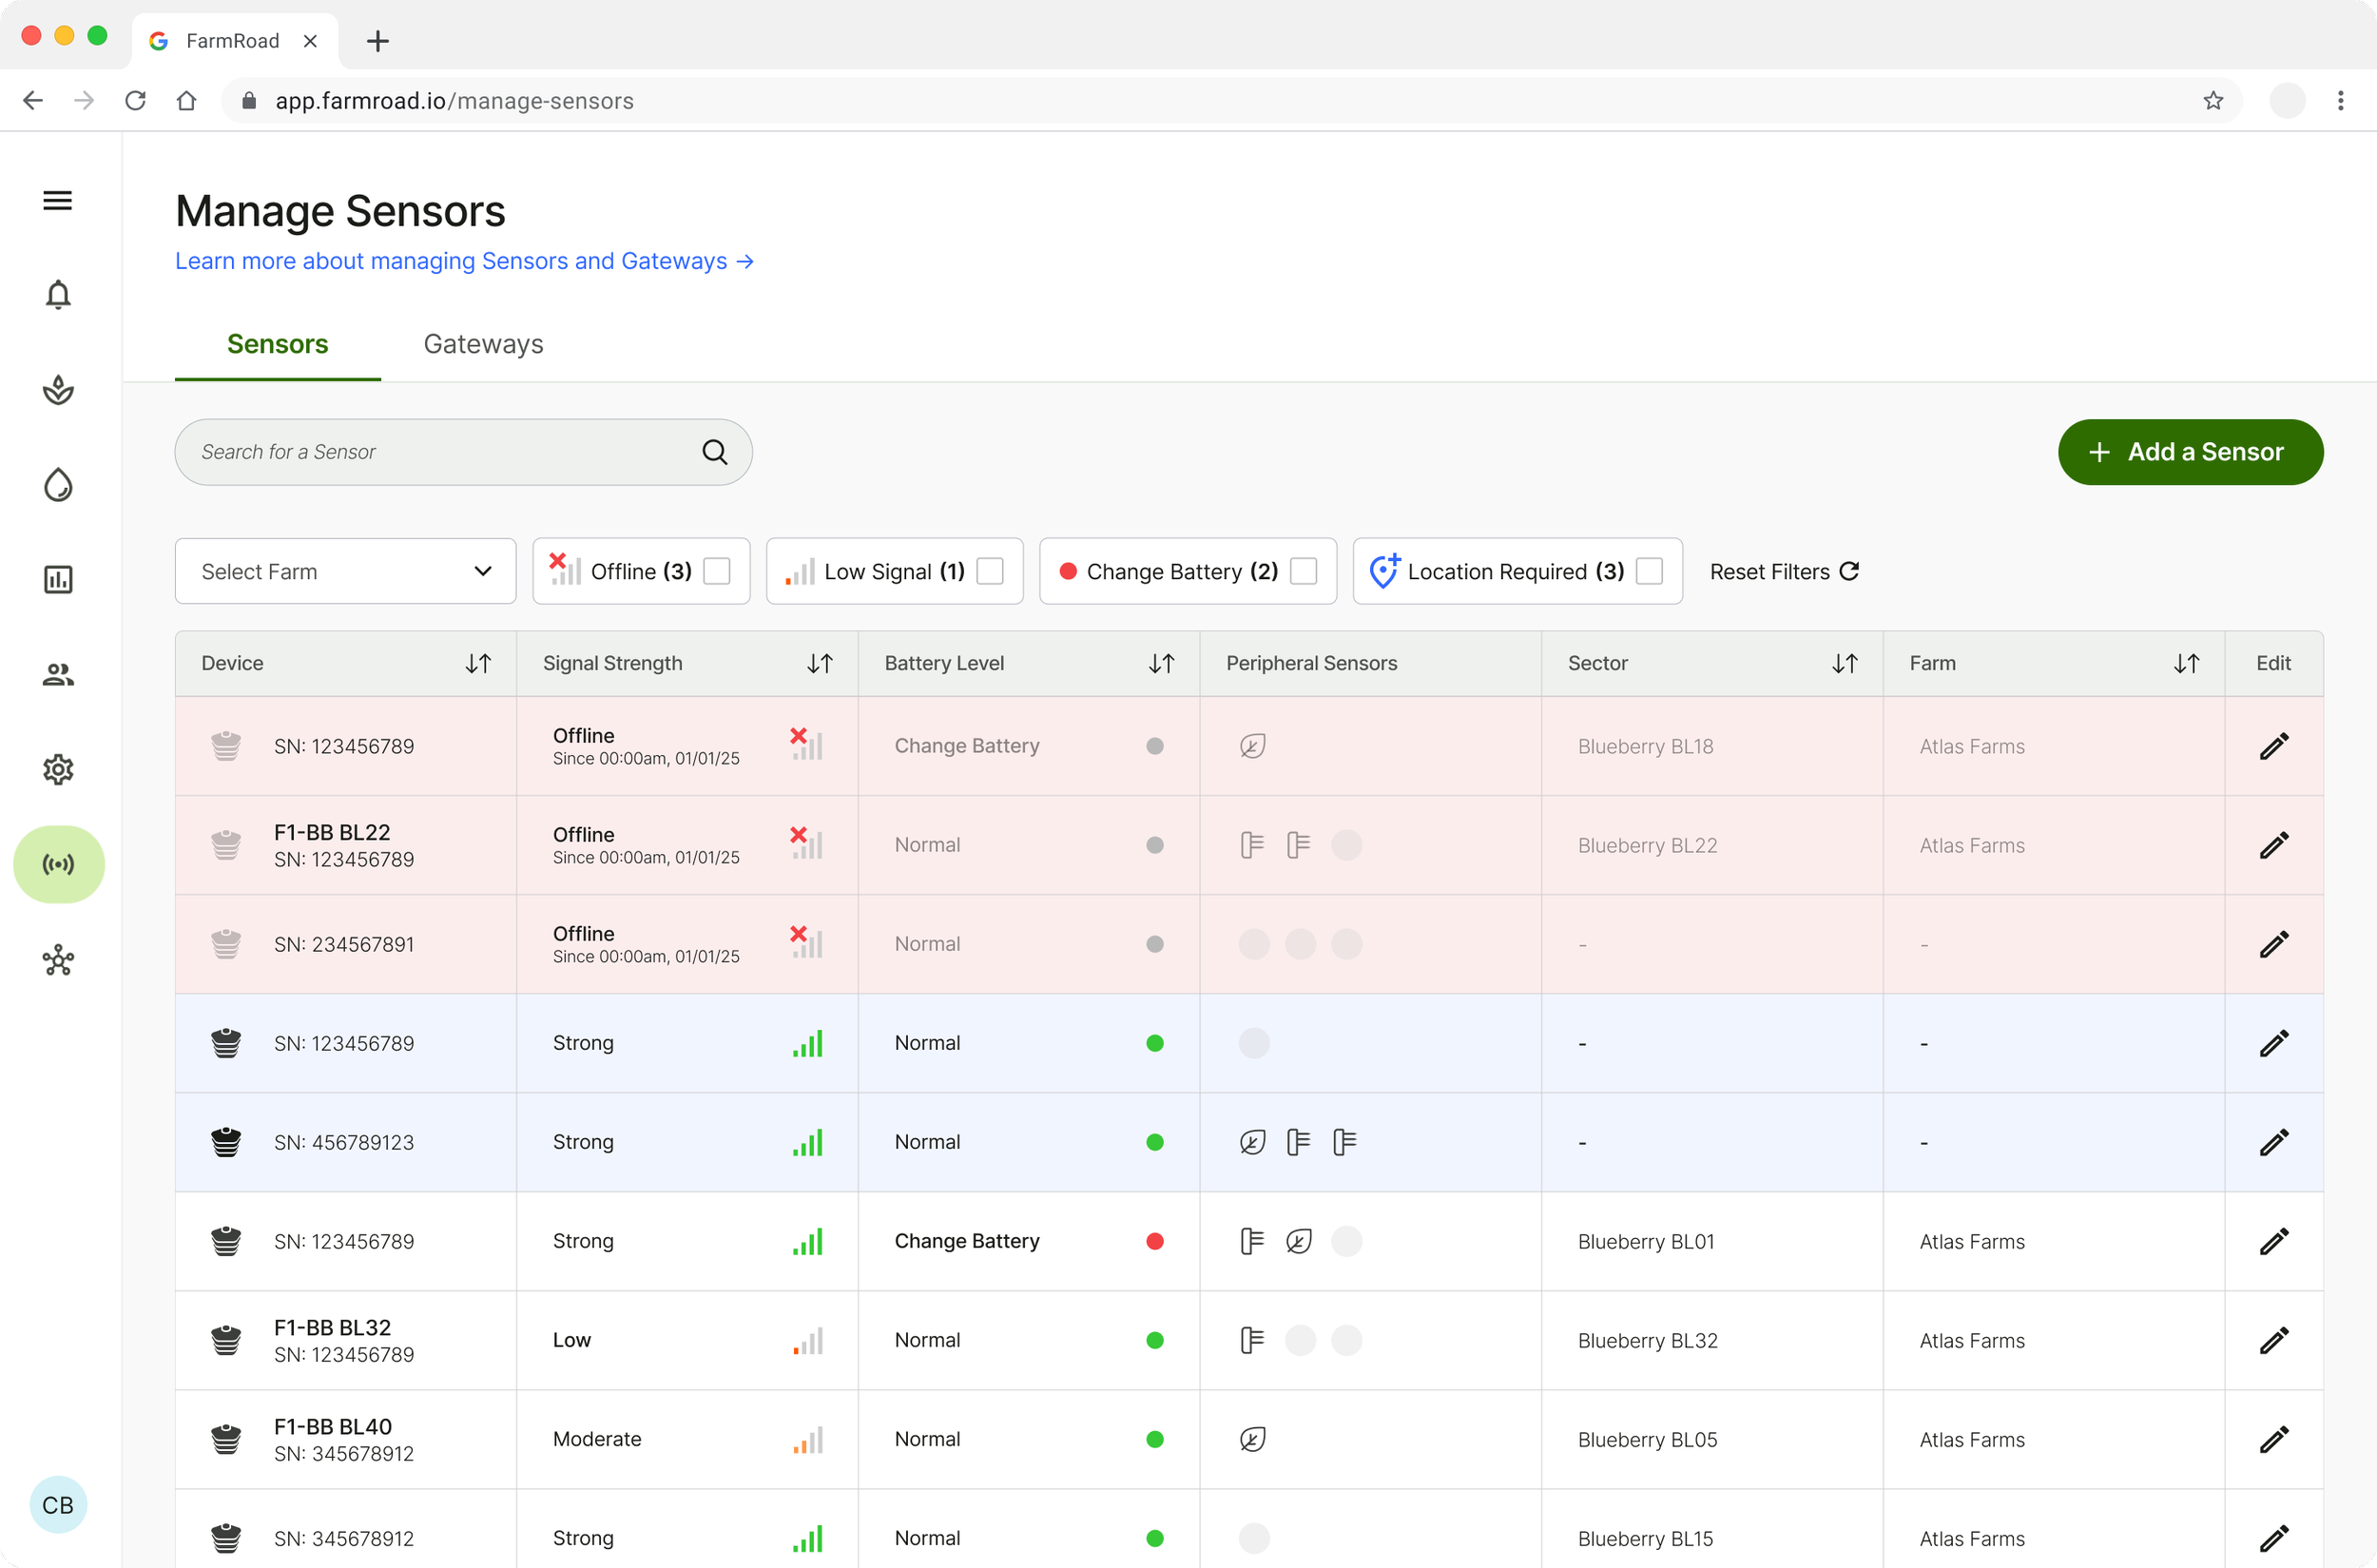
The Solution
The new design uses a clean tabular layout which made the most of the desktop real estate, with improved at-a-glance views on sensor details - adding more columns with independent context as opposed to stacked information in a crammed container.
I also worked with our hardware engineer to understand what information we could and couldn’t diagnose with sensor data and the level of detail we could communicate to users. This allowed me to introduce visibility on:
Battery Levels: so users knew when they needed to change the battery or confirm why a sensor may be offline
Signal Strength: to determine if a sensor is placed within appropriate range of a gateway to send data
Offline/Online Status: to diagnose data drop-off and connectivity issues
and Connected Peripheral Sensors: to enable remote confirmation of which peripherals were connected to the Folium and successfully sending data.
The new table design also meant we could introduce quick ASC/DESC sorting for each column, a dropdown to filter sensors by farm, as well as quick filter selection for critical diagnostics e.g. offline, battery change, low signal.
New Design
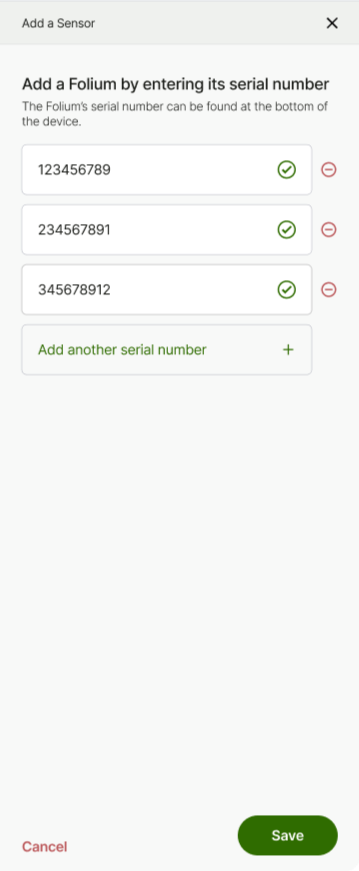
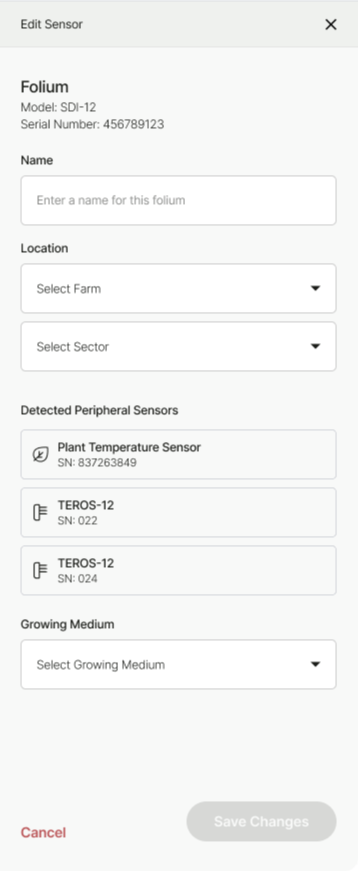
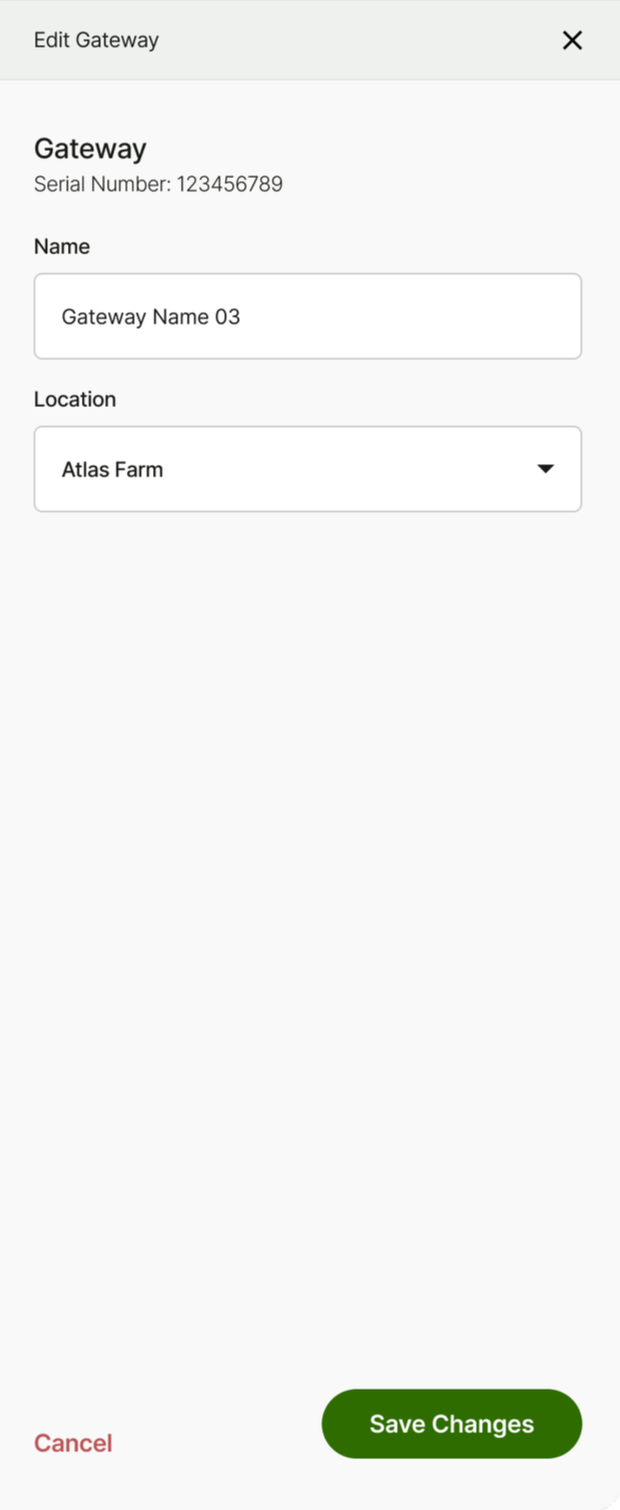
Updated add / edit panels
I also found opportunity for changes in the add sensor and editing panels to:
Allow users to bulk-add serial numbers, with per-serial validation
Remotely view connected peripheral sensors and their unique IDs - previously these were manually added and if a sensor was disconnected or switched there was no way of knowing without visual confirmation.
Enable users to edit gateway name and location directly
each of which previously required manual configuration by a developer or a member of the CS team.